Nationwide 5G Congestion & Spatial Data Indexer
312 sites of 5G telemetry reduced to a few hundred decisions.
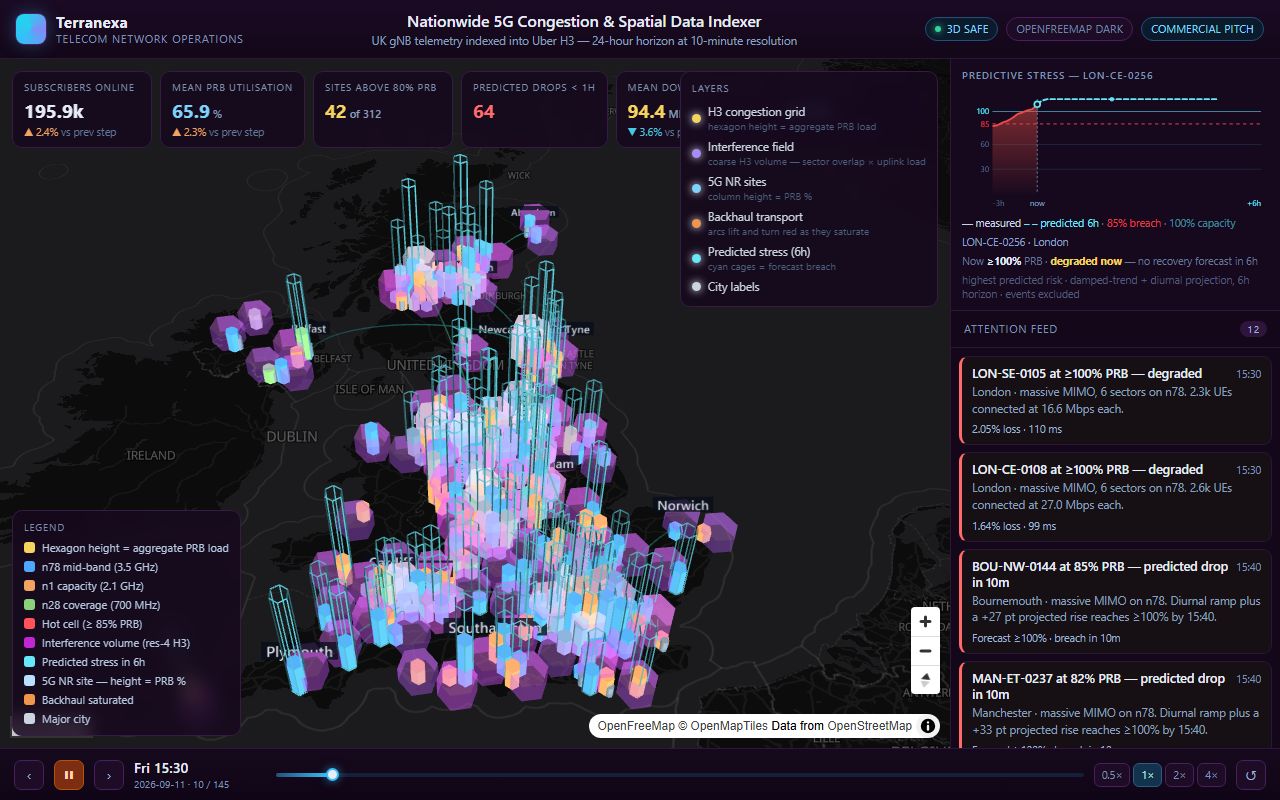
Captured from the running product. telecom5gcongestion.terranexamaps.com
312 5G NR sites stream PRB utilisation, active users, throughput, latency and packet loss every ten minutes across the UK. Indexed into an Uber H3 hexagon grid, a multi-million row stream becomes a few hundred operational decisions.
A causal stress model forecasts PRB saturation up to six hours ahead, and predicted-versus-actual is rendered as a visibly distinct overlay — so an operator can see where the model is right and where it is drifting, rather than trusting a single blended figure.
What is actually running
- 312 5G NR sites streaming PRB, UE, throughput, latency and packet-loss telemetry every 10 minutes.
- Every reading indexed into an Uber H3 hexagon grid, turning a multi-million row stream into a few hundred operational decisions.
- Causal stress model forecasts PRB saturation up to 6 hours ahead.
- Predicted-versus-actual rendered as a distinct overlay rather than buried in a footnote.
Built with
Open the live product
This is the deployed application, not a recording. It opens in a new tab and runs in your browser.