Eleven spatial systems, running right now.
Every project below is live and openable — not a screenshot of a proposal. They are built on one shared spatio-temporal engine, so what changes between them is the data model and the domain logic, not the technology. Open any project to read what it actually models, then launch it.
11
live demos
11
industries
1
shared engine
0
mocked screenshots
 Power distribution
Live
Power distribution
Live
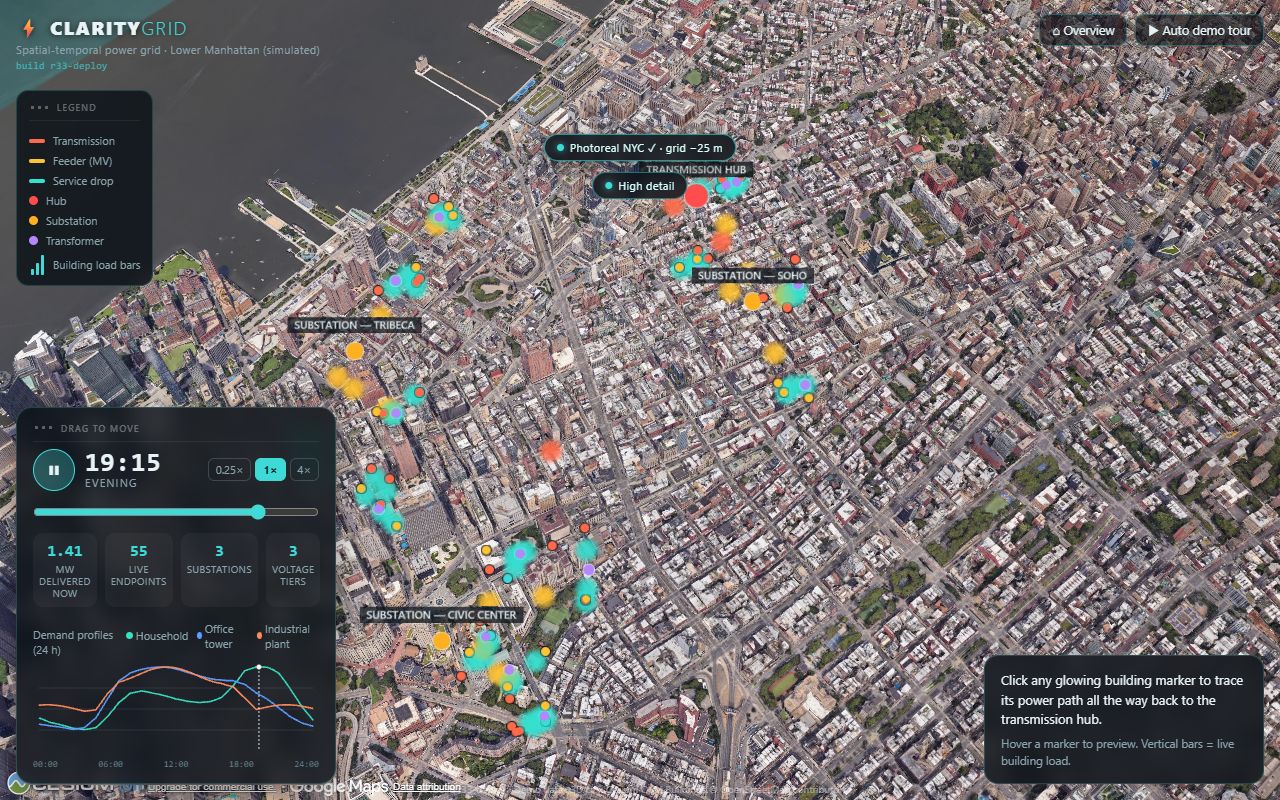
ClarityGrid — Power Flow Digital Twin
Watch electricity move from a transmission hub through substations, feeders and transformers to individual buildings — in photoreal 3D Lower Manhattan, with a time scrubber over the load cycle.
 Maritime intelligence
Live
Maritime intelligence
Live
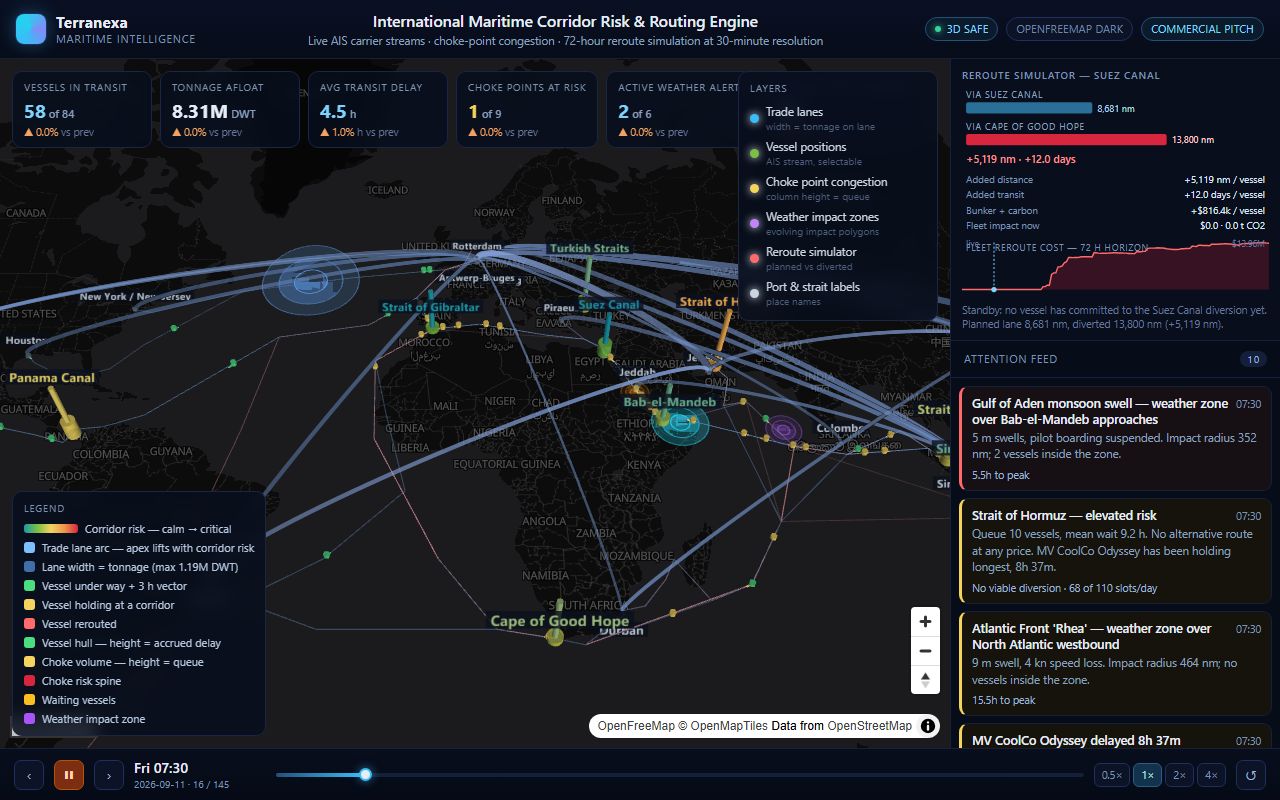
Maritime Corridor Risk & Routing
Tracks vessel traffic through the nine choke points that carry world trade, and prices a reroute the moment one of them closes.
 Cold chain
Live
Cold chain
Live
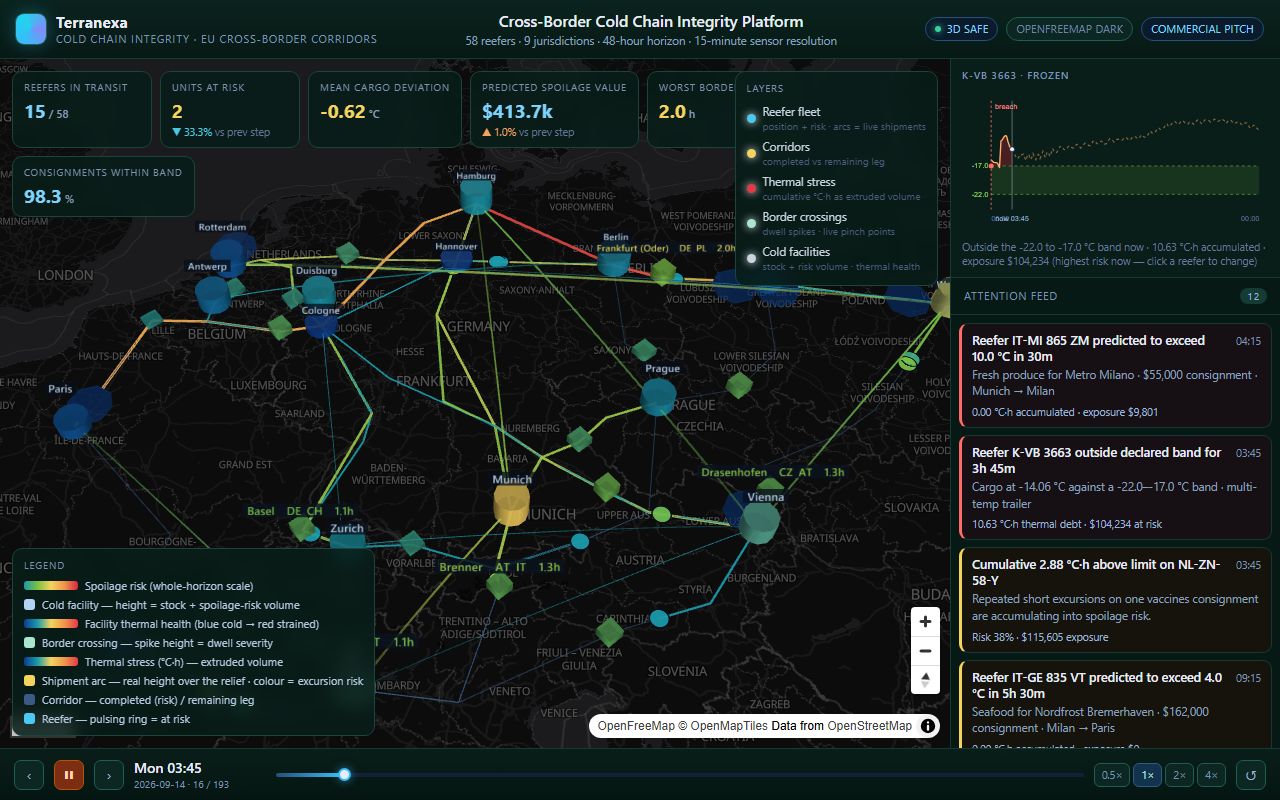
Cold Chain Integrity Platform
Follows temperature-controlled consignments across nine jurisdictions on a 48-hour horizon, forecasting integrity breaches hours before they happen.
 Telecom
Live
Telecom
Live
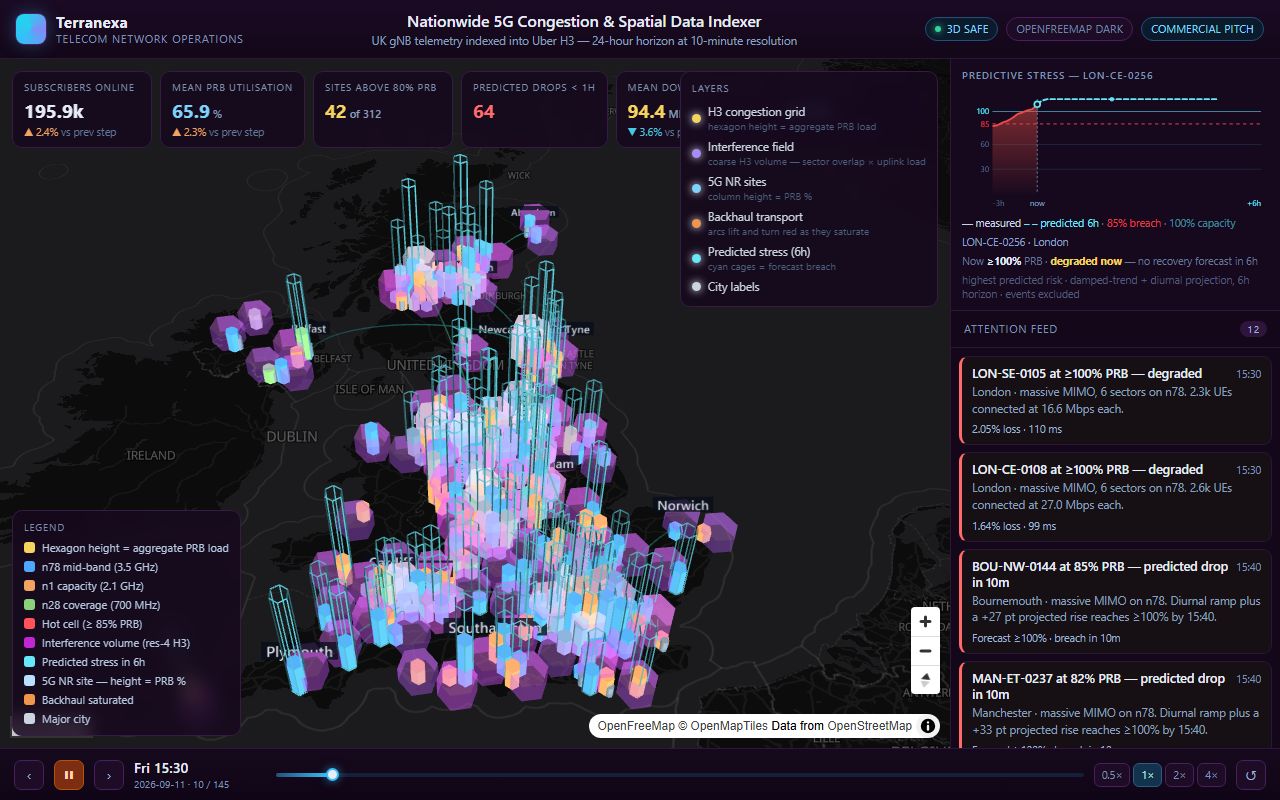
Nationwide 5G Congestion Indexer
Mobile network telemetry indexed into a hexagonal grid, giving a 24-hour view of congestion at ten-minute resolution.
 Airspace
Live
Airspace
Live
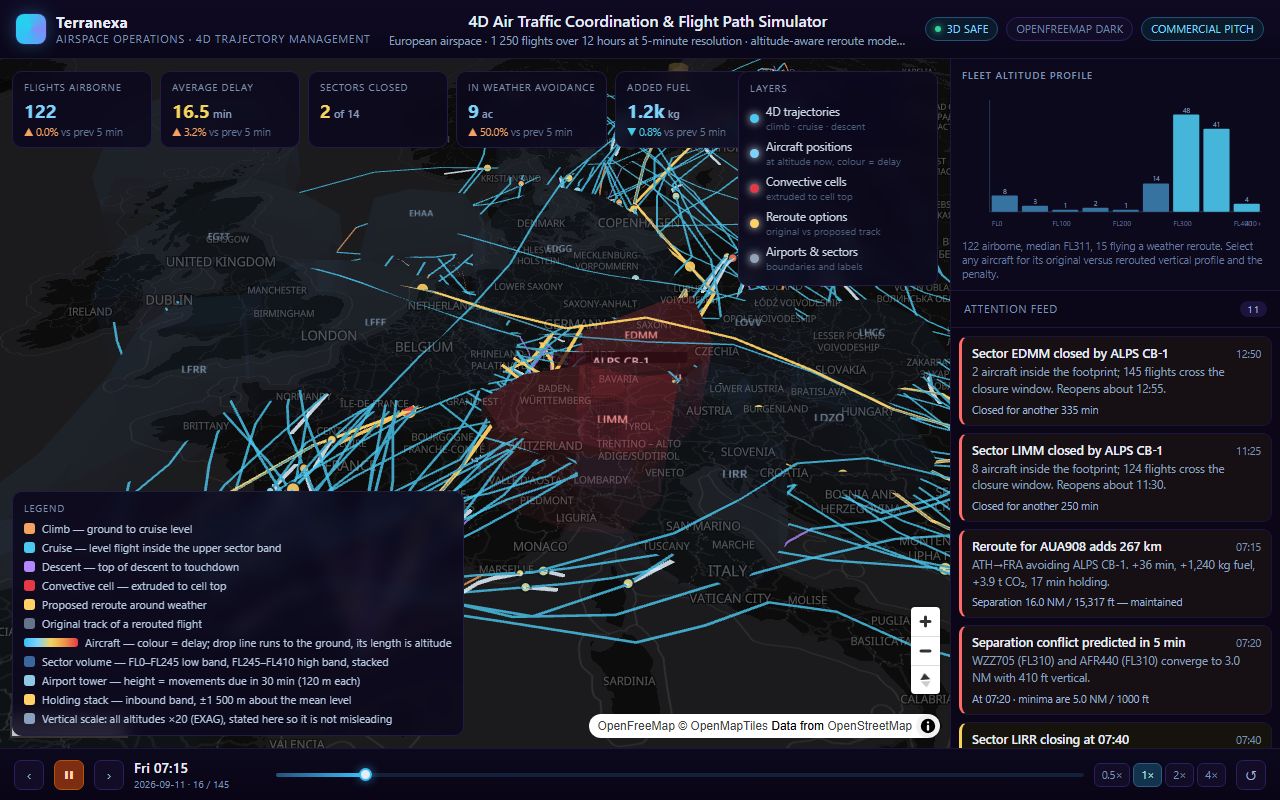
4D Air Traffic Coordination
1,250 flights moving through European airspace over twelve hours, with altitude-aware reroute modelling when sectors reach capacity.
 Transit
Live
Transit
Live
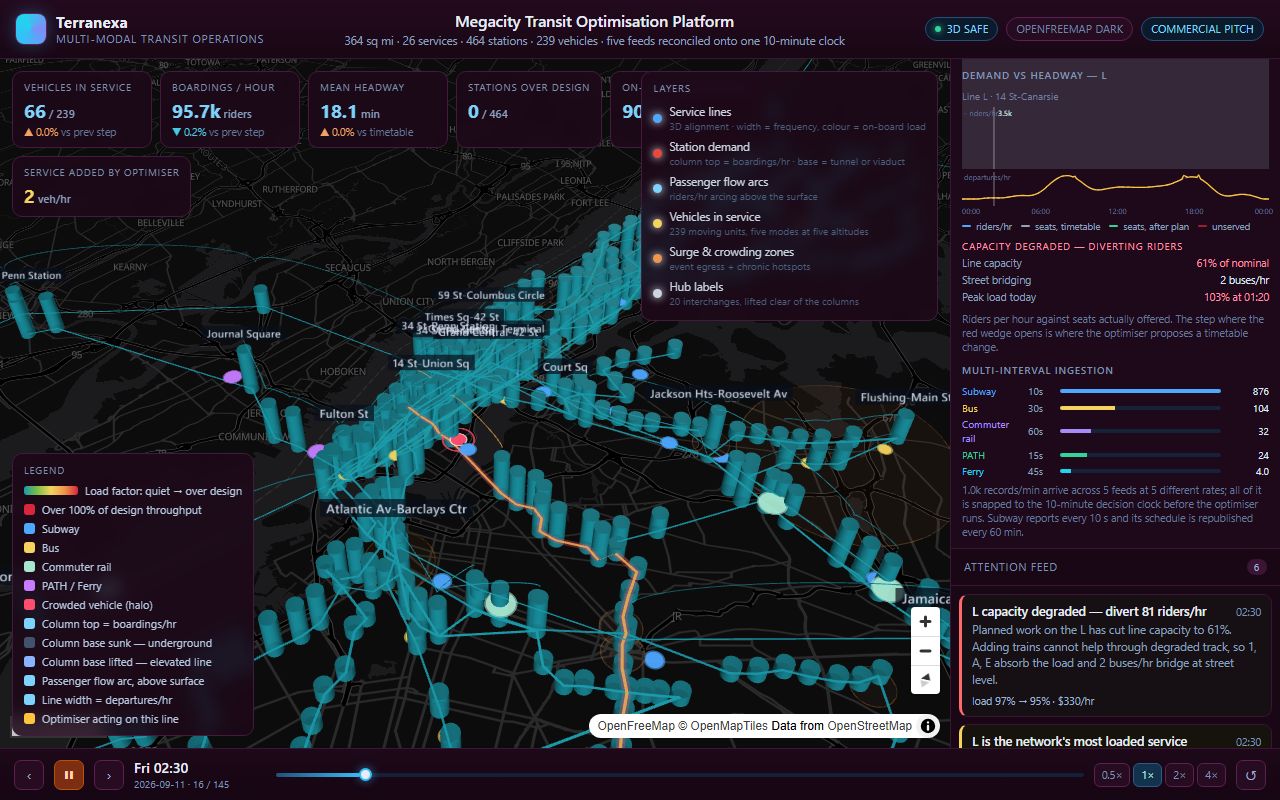
Megacity Transit Optimisation
Five separate transit feeds reconciled onto a single ten-minute decision clock, across 464 stations and 239 vehicles.
 Supply chain risk
Live
Supply chain risk
Live
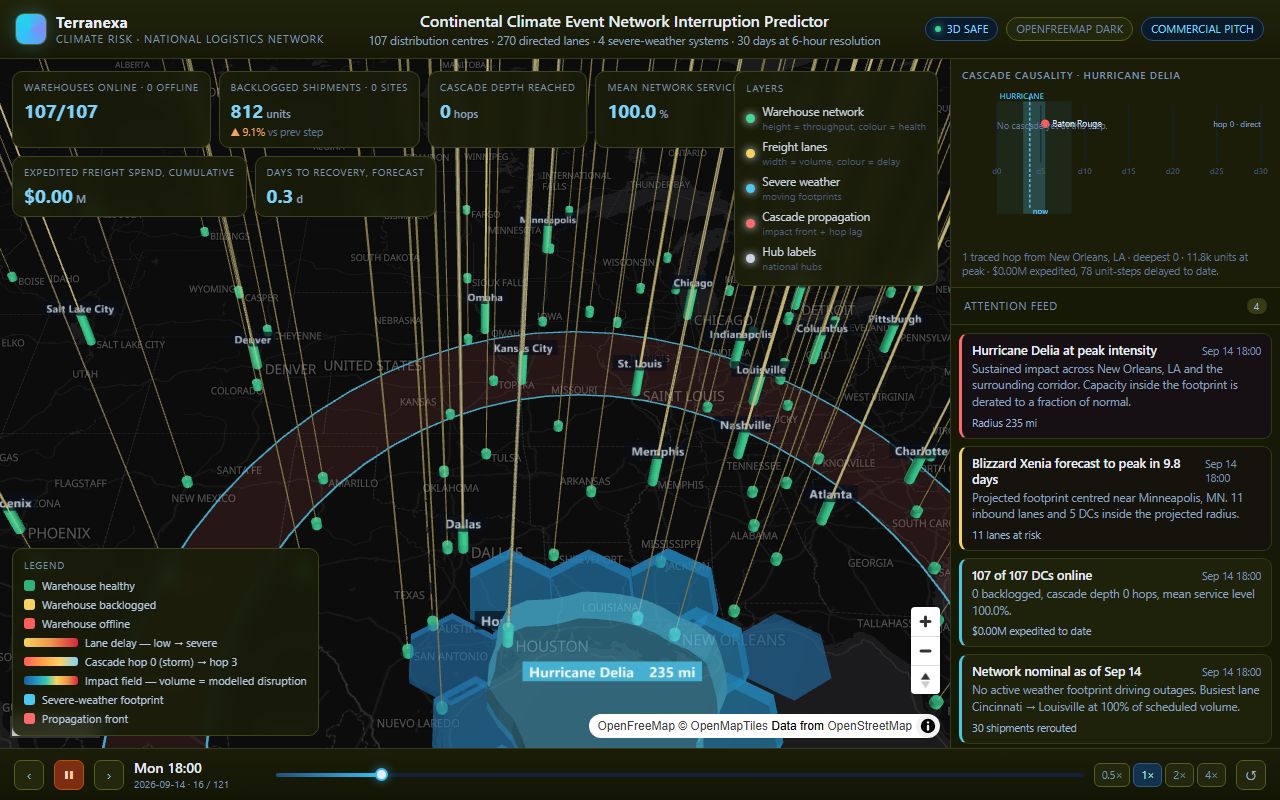
Climate Event Cascade Predictor
107 distribution centres and 270 transport lanes modelled against four severe weather systems — showing how a disruption at one site propagates through the network.
 Agriculture
Live
Agriculture
Live
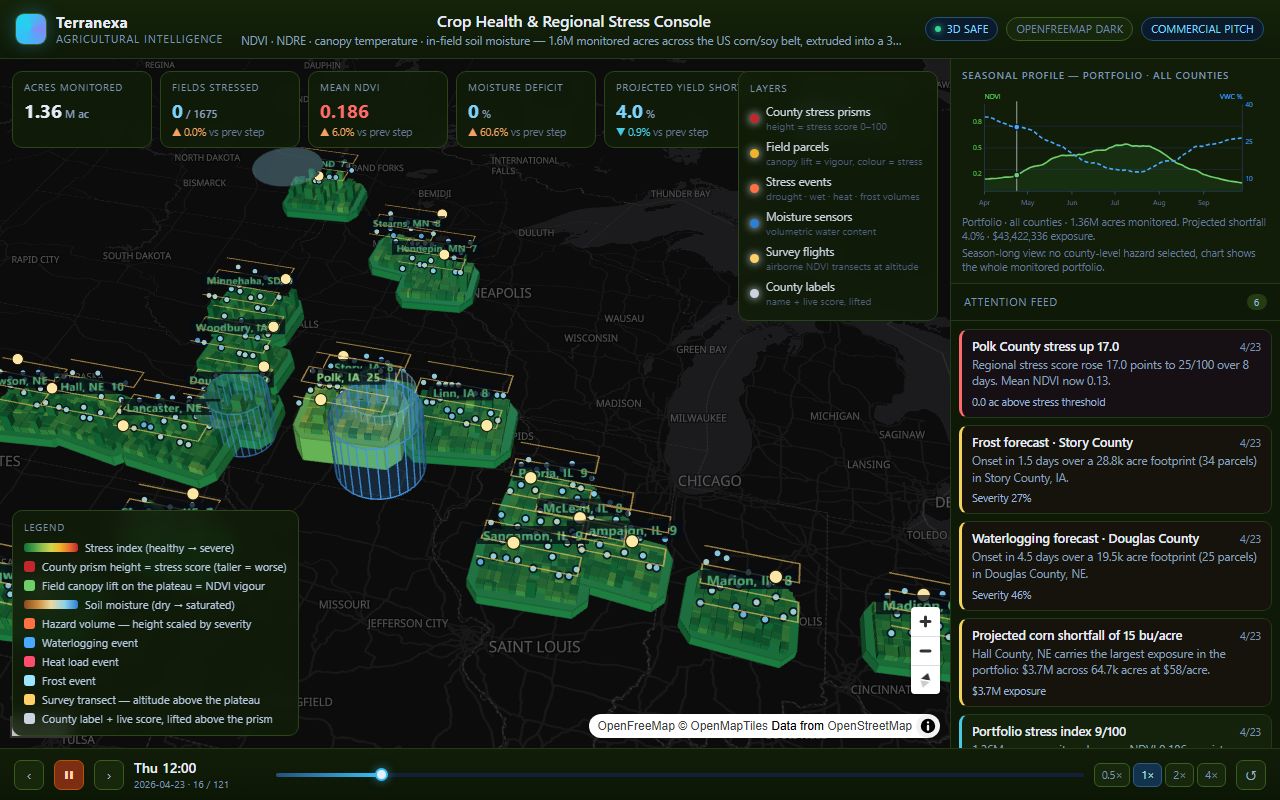
Crop Health & Regional Stress
1.6 million monitored acres across the US corn and soy belt, combining four satellite indices with in-field sensors into a 3D stress landscape.
 Water utilities
Live
Water utilities
Live
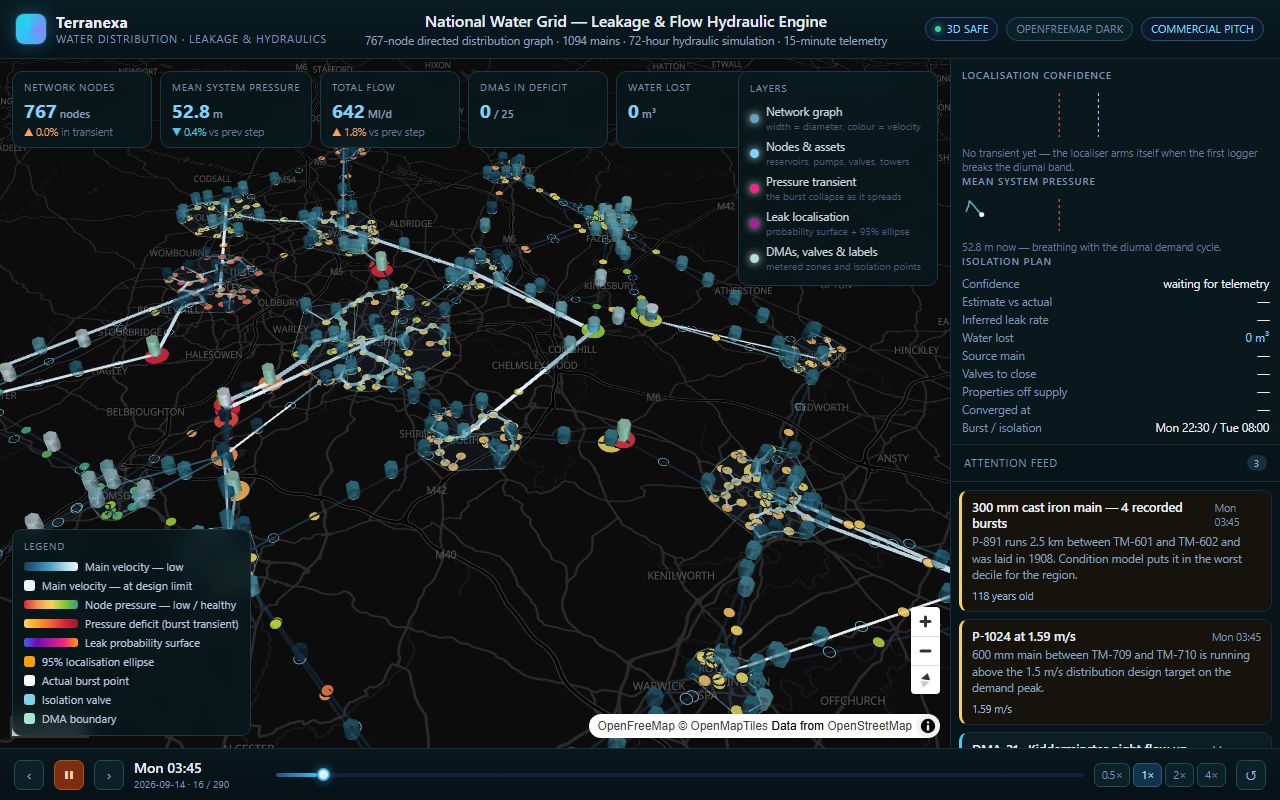
Water Grid Leakage & Hydraulics
A 767-node distribution network running a 72-hour hydraulic simulation, isolating where water is being lost and how flow redistributes downstream.
 Energy markets
Live
Energy markets
Live
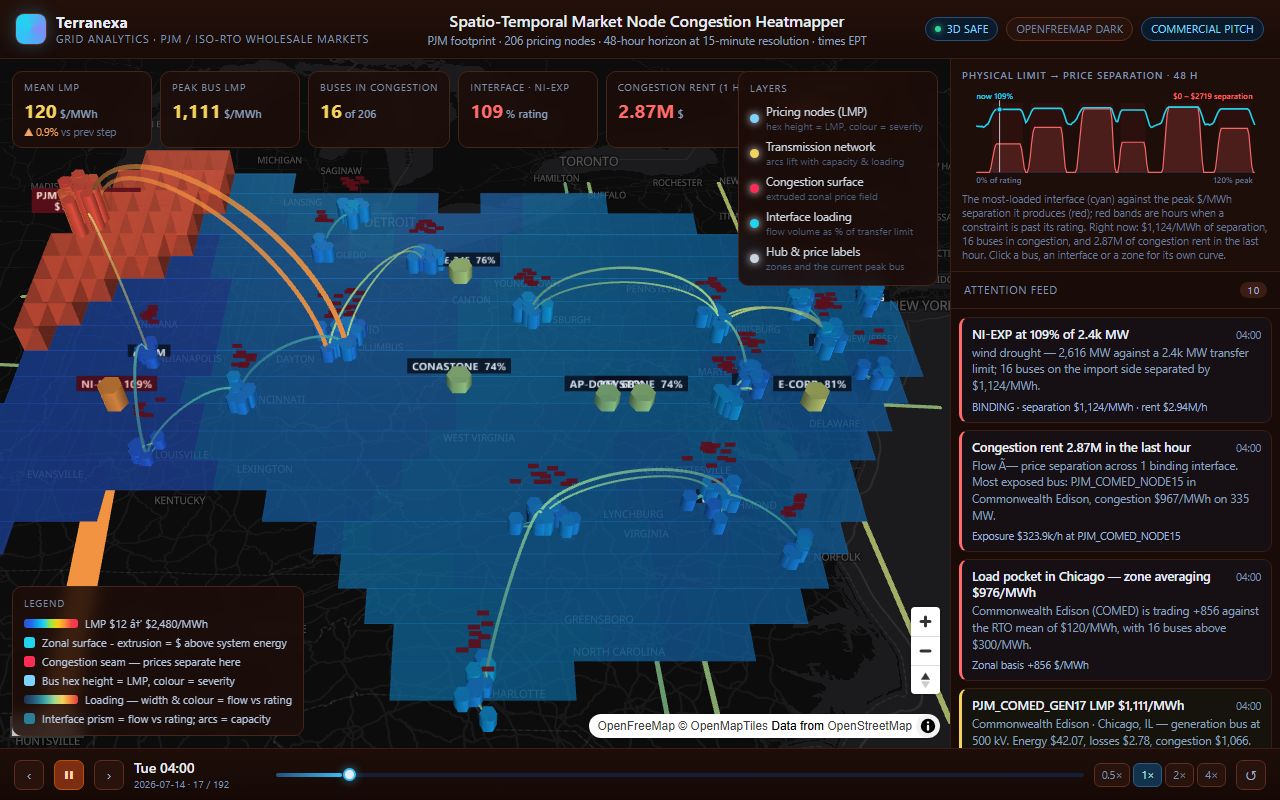
Market Node Congestion Heatmapper
The PJM footprint across 206 pricing nodes and 48 hours — showing exactly where transmission congestion appears and what it costs.
 Energy storage
Live
Energy storage
Live
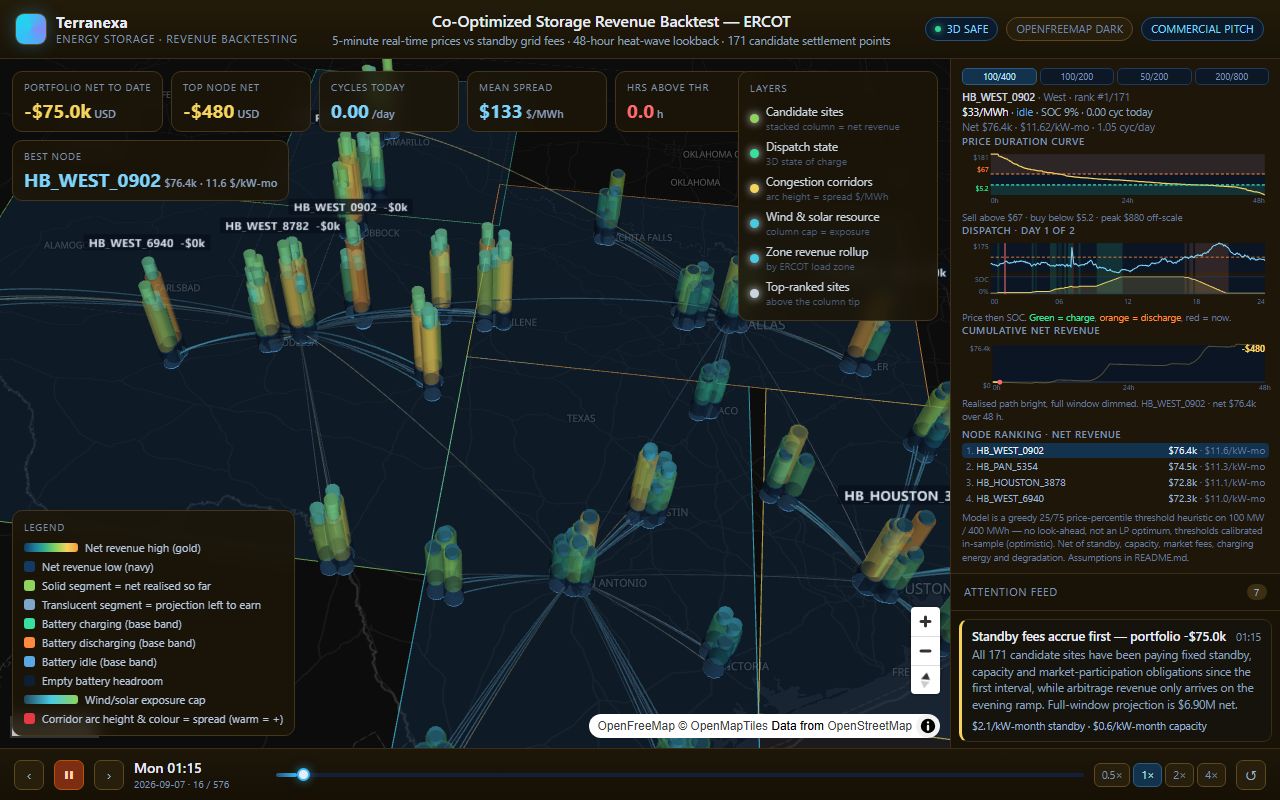
Storage Revenue Backtest — ERCOT
Backtests storage revenue across 171 settlement points against real five-minute prices and standby fees, over a 48-hour heat-wave window.
These are in-house products built to demonstrate capability, and each one says so on its own page. Figures come from the running simulation, not from client telemetry.
Demonstration & concept projects
Earlier capability demos, kept here for reference. These are exploratory builds rather than deployed products, so they have no live link.
Smart City GIS Platform
An interactive city map bringing buildings, roads, hospitals, schools and public facilities into a single WebGIS platform.
- Interactive map layers
- Population & traffic information
- Search and filters
- Built-in analytics
- Facility management views
Goal — Demonstrate the ability to create a professional WebGIS platform.
Utility Network GIS
An interactive utility map showing electricity infrastructure, assets, network connections and maintenance information.
- Asset status monitoring
- Network connection tracing
- Maintenance records
- Interactive dashboard
- Search and filtering
Goal — Demonstrate the ability to build GIS solutions for utility and infrastructure companies.
3D Infrastructure Digital Twin
A 3D geospatial application rendering buildings, terrain, roads and infrastructure as an explorable digital twin.
- 3D terrain and buildings
- Infrastructure layers
- Interactive geographic data
- Camera-driven storytelling
- Cesium-based rendering
Goal — Demonstrate advanced 3D geospatial development capabilities.
Want something like this for your organization?
Tell us what you are trying to model. We will review the requirements and suggest a technical approach.