TerraNexa
11 systems live · 1 shared engine Enterprise solutions

Enterprise geospatial systems, built to run.

We design, build and operate 3D WebGIS, digital-twin and spatial analytics systems for utilities, infrastructure operators, government programmes and enterprises. Every system in the portfolio below is deployed, so you can evaluate the work by opening it rather than reading about it — and the same small team that scopes your project writes it.

Spatio-temporal engine Live
  • Twin
  • Telemetry
  • Sensors
  • Assets
Four source layers, one clock.
  • 11 live applications you can open
  • 1 shared spatio-temporal engine
  • 7 continents served
  • <6h reply to enquiries
Why enterprises work with us

What you get that a staff-augmentation contract does not

Four things we can be held to, each of which is visible in the portfolio rather than asserted on this page.

  1. We ship running systems, not slideware

    Eleven products in this portfolio are deployed and openable by anyone you send the link to. That is the standard we are proposing to hold your project to: every claim on a status call is a URL your team can open.

  2. One engine, many domains

    Our products share one spatio-temporal engine, so the difference between them is the data model and the domain logic rather than the technology. That is why the effort of moving into your sector is mostly modelling work, not a platform rebuild.

  3. Senior engineers on the delivery path

    There is no layer between the people who scoped your work and the people writing it. Requirements, architecture and implementation stay with the same small team from kick-off to handover.

  4. Built to be handed over

    Documented schemas, migration scripts, infrastructure-as-code and reproducible deploys. If you require the option to take the system in-house after go-live, we build for that from the first sprint rather than retrofitting it.

Core technical capabilities

What we build

Three offerings, in the order a programme meets them: build the interface, model the data underneath it, and keep the data current.

Build

Interactive 3D WebGIS prototypes and dashboards

Photoreal and schematic 3D scenes, operational dashboards and analyst tools that run in the browser with no install. We can put a defensible prototype in front of a client in weeks to de-risk a bid, then harden the same codebase into the delivered system.

  • Cesium, deck.gl and MapLibre scenes over real terrain and 3D tiles
  • Operational dashboards, time scrubbers and scenario controls
  • Prototype-to-production on one codebase, not a throwaway demo
Model

Spatial database management and analysis pipelines

PostGIS schemas, ETL, tiling and scheduled analysis. Geospatial systems fail on data far more often than on rendering, so this is where we spend the effort the visuals do not advertise.

  • PostgreSQL/PostGIS schema design, indexing and migration tooling
  • ETL and tiling pipelines for vector, raster and point-cloud data
  • Reproducible scheduled analysis with monitored runs
Integrate

Remote sensing and spatial data integration

Satellite and aerial imagery, sensor feeds and third-party APIs brought onto one timeline so operators see current conditions instead of last month’s export.

  • Sentinel and Landsat ingestion, cloud masking and derived indices
  • Live feed integration: AIS, telemetry, IoT and weather
  • Fusion of disparate sources onto a single reconciled timeline
How a system gets built

The delivery path, from scope to handover

Four stages, and the same small team on all four. This is the sequence the portfolio was built through; on your programme the data model changes, the method does not.

  1. Scope

    We take the problem, the constraints and the deadline, and come back with the architecture, the data model and an effort estimate — written by the engineers who will do the work, not by a pre-sales layer.

  2. Prototype

    A running prototype on your real data, in front of your stakeholders early. It is the cheapest point at which to be wrong, and it is what de-risks the business case before the build budget is committed.

  3. Production

    The same codebase hardened rather than rewritten: schemas migrated and indexed, pipelines scheduled and monitored, performance measured instead of assumed.

  4. Handover

    Documented schemas, migration scripts, infrastructure-as-code and reproducible deploys, so your team can operate the system or take it in-house on the terms you asked for.

Operational picture

One live view of the whole estate

GEV GEV — God’s Eye View

One continuously updated operational picture of an entire site, network or portfolio, read as a single live 3D view.

Most programmes already hold the data that matters; it is simply split across a SCADA screen, a GIS file, a spreadsheet and someone’s inbox. GEV composites those layers into one scene that updates continuously rather than on export: the digital twin, the live telemetry, the sensor feeds and the asset register, resolved onto the same coordinates and the same clock.

Scan
Layers fused onto one clock

Whole-network situational awareness in one view, rather than per-system screens

Live ingest, so the picture is current rather than last night’s batch

Drill from the network overview down to a single asset without changing tools

Incident and scenario playback over the same scene you operate from

Technical stack

The infrastructure your system would land on

A technical evaluator should be able to scan this and know whether we fit your estate. If a tool you depend on is not listed, ask — this list is the stack we build on rather than a full inventory of everything the team has touched.

3D & GPU rendering

07
  • CesiumJS
  • deck.gl
  • MapLibre GL JS
  • Mapbox GL JS
  • Three.js
  • Google Photorealistic 3D Tiles
  • WebGL / WebGPU

GIS platforms

05
  • ArcGIS JS API
  • ArcGIS Pro
  • ArcGIS Enterprise
  • QGIS
  • GRASS GIS

2D web mapping

02
  • Leaflet
  • OpenLayers

Spatial data & back end

10
  • PostgreSQL + PostGIS
  • GeoServer
  • GDAL / OGR
  • PDAL
  • rasterio
  • GeoPandas
  • DuckDB Spatial
  • GeoParquet
  • PMTiles
  • STAC

Earth observation

06
  • Sentinel-2
  • Landsat
  • Google Earth Engine
  • SAR
  • Remote-sensing pipelines
  • Cloud masking & derived indices

Engineering & delivery

11
  • React
  • TypeScript
  • Node.js
  • Python
  • FastAPI
  • Docker
  • Kubernetes
  • Terraform
  • GitHub Actions
  • AWS / Azure / GCP
  • Nginx
Portfolio & proven prototypes

Running systems, openable from this page

Every product below is deployed and live. Open any of them and you are looking at the application itself, not a recording or a concept render.

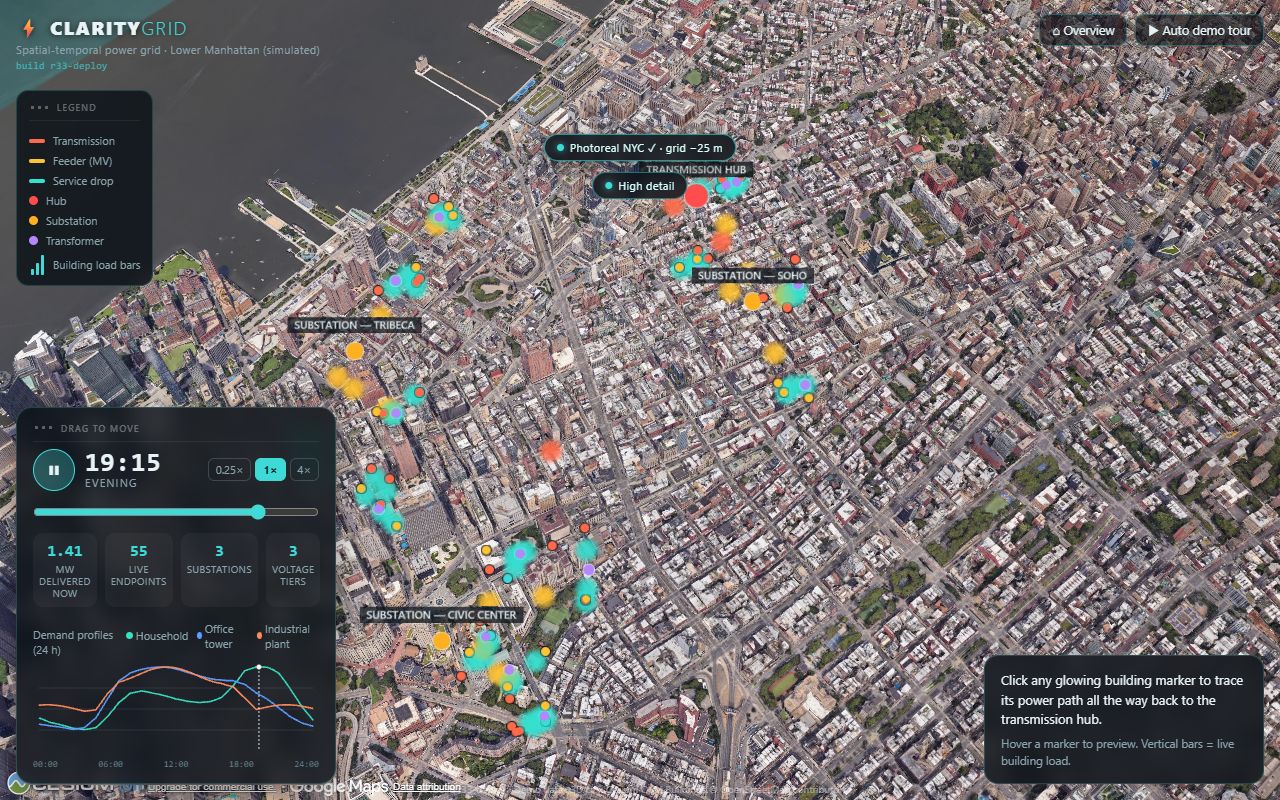
ClarityGrid Live
ClarityGrid — the running interface
Digital twin claritygrid.terranexamaps.com
Electricity distribution

ClarityGrid

Watch electricity move from a transmission hub through substations, feeders and transformers to individual buildings — in photoreal 3D Lower Manhattan, with a time scrubber over the load cycle.

ClarityGrid is the clearest example of what we would build for a distribution utility or a network operator: a full radial topology modelled as a graph and rendered onto photoreal 3D Lower Manhattan, with power visibly flowing from a transmission hub down through substations, feeders and transformers to individual metered customers. Every building carries its own live consumption, aggregated upward from customer-class load shapes, and a time scrubber runs the whole network across the daily load cycle.

Kind
Digital twin
Metrics
73 network links · 55 metered customers
Built with
CesiumJS · Google 3D Tiles · Time scrubber · Graph simulation
CashPilot Live
Full-stack SaaS cashpilot.terranexamaps.com
Accounts receivable automation

CashPilot

A deployed micro-SaaS that tracks unpaid invoices, automates professional payment reminders, scores payment risk and drafts the awkward follow-up conversations with an AI assistant. Included here as evidence that we ship complete transactional systems — auth, billing, background jobs and AI — not only maps.

Kind
Full-stack SaaS
Metrics
Stripe subscription billing · AI payment assistant
Built with
Node.js + Express · React 18 + Vite · SQLite · Stripe subscriptions · OpenAI / Anthropic · Nodemailer

Also live, across ten more domains

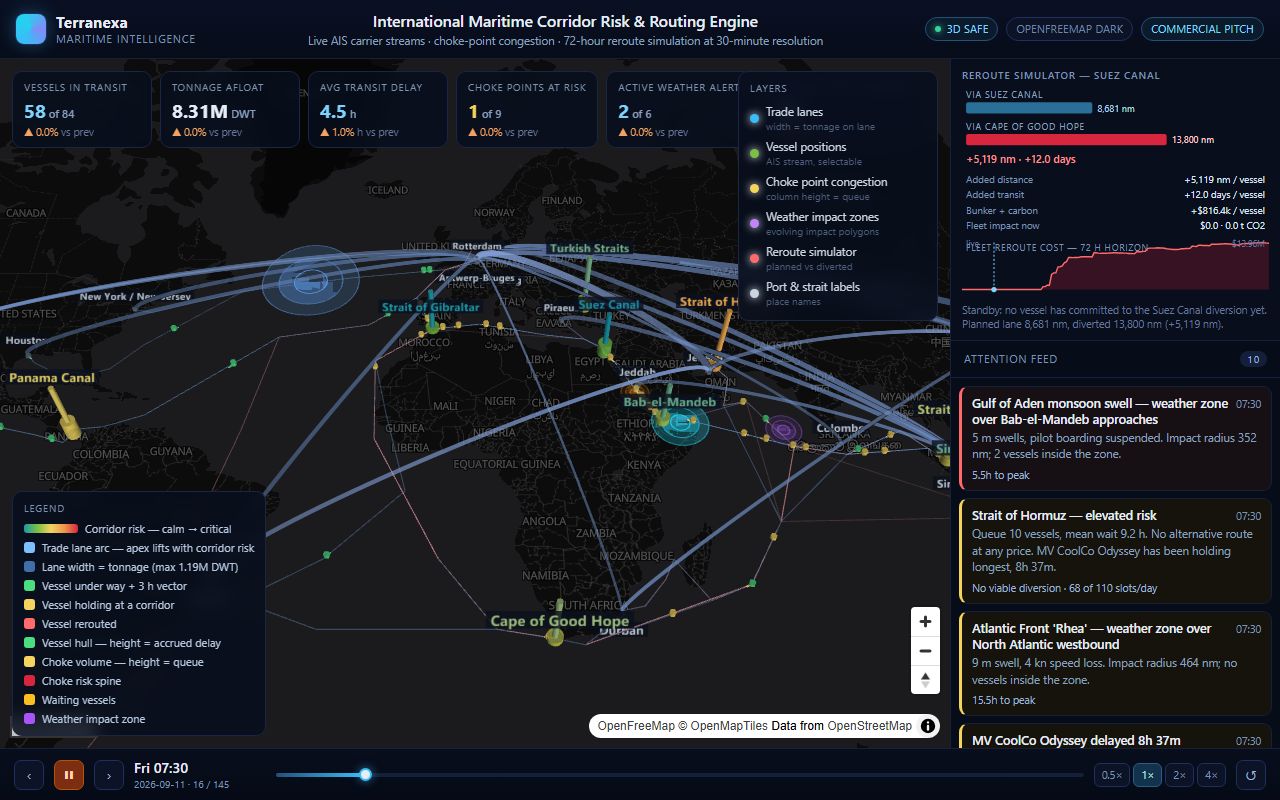
Maritime Corridor Risk & Routing — the running interface
Maritime intelligence Live
Global logistics & shipping

Maritime Corridor Risk & Routing

Tracks vessel traffic through the nine choke points that carry world trade, and prices a reroute the moment one of them closes.

9 choke points72h horizon

Open the project
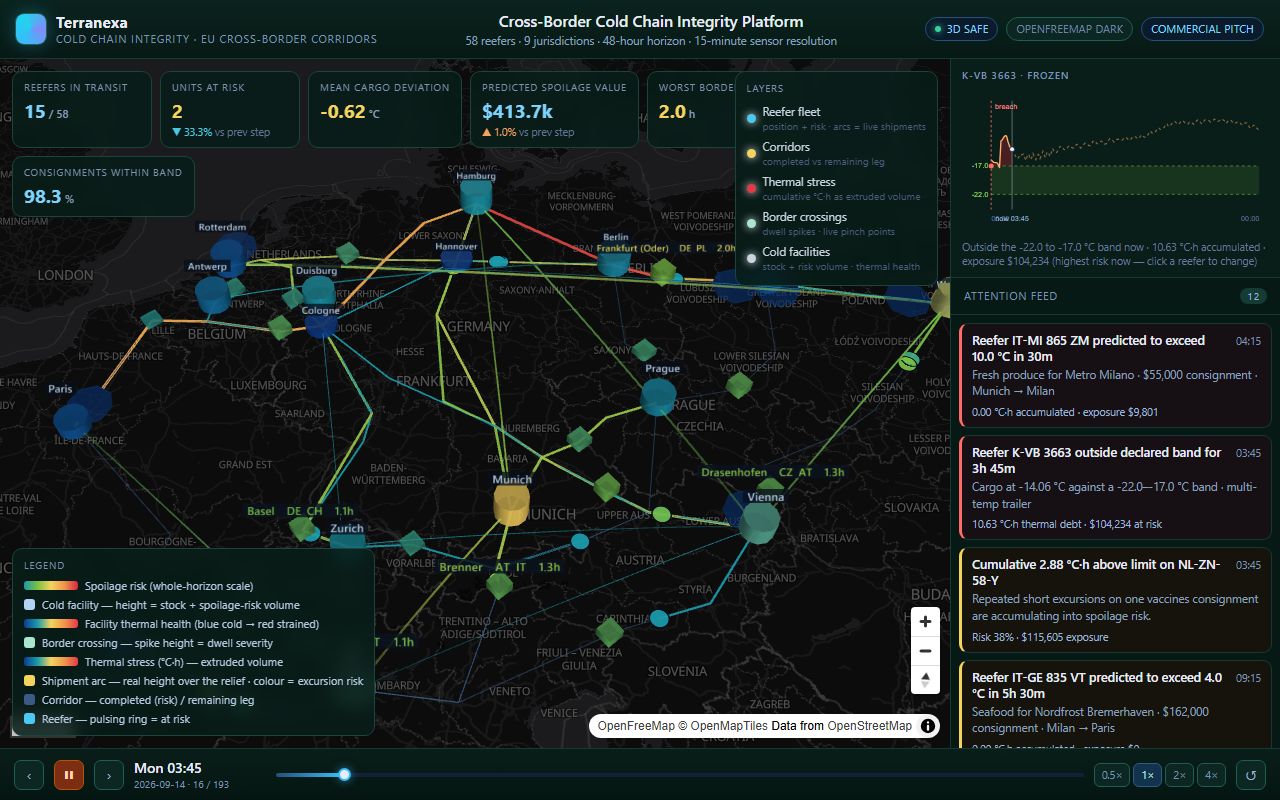
Cold Chain Integrity Platform — the running interface
Cold chain Live
Pharma & food logistics

Cold Chain Integrity Platform

Follows temperature-controlled consignments across nine jurisdictions on a 48-hour horizon, forecasting integrity breaches hours before they happen.

9 jurisdictions48h horizon

Open the project
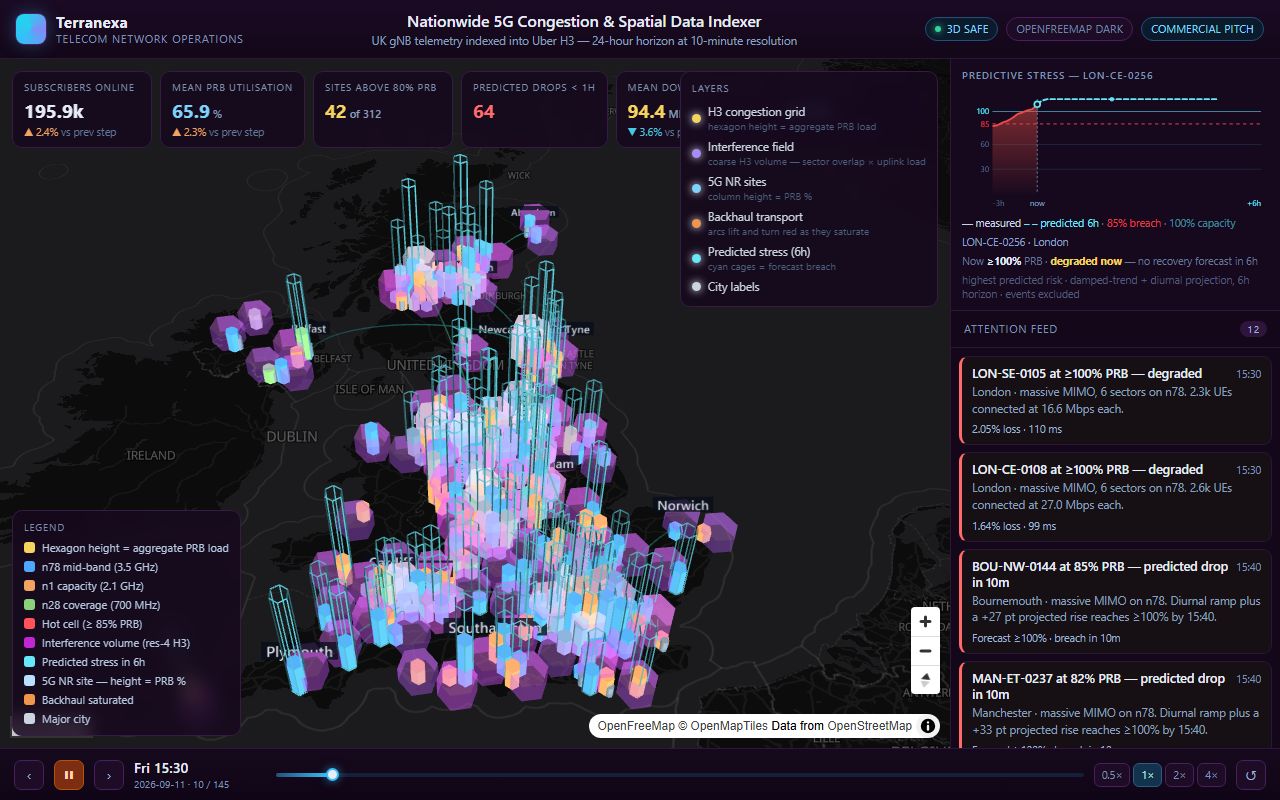
Nationwide 5G Congestion Indexer — the running interface
Telecom Live
Mobile network operations

Nationwide 5G Congestion Indexer

Mobile network telemetry indexed into a hexagonal grid, giving a 24-hour view of congestion at ten-minute resolution.

312 5G sites24h horizon

Open the project
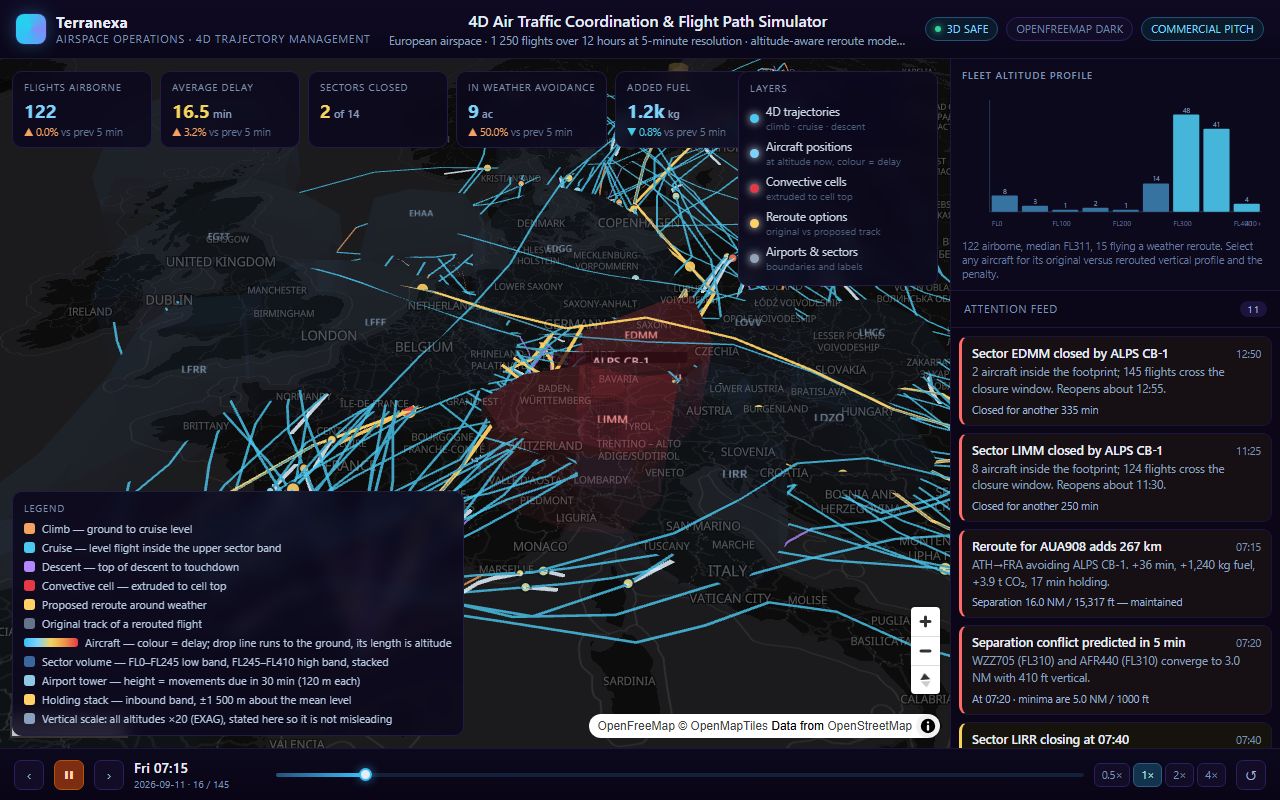
4D Air Traffic Coordination — the running interface
Airspace Live
Air traffic management

4D Air Traffic Coordination

1,250 flights moving through European airspace over twelve hours, with altitude-aware reroute modelling when sectors reach capacity.

1,250 flights12h horizon

Open the project
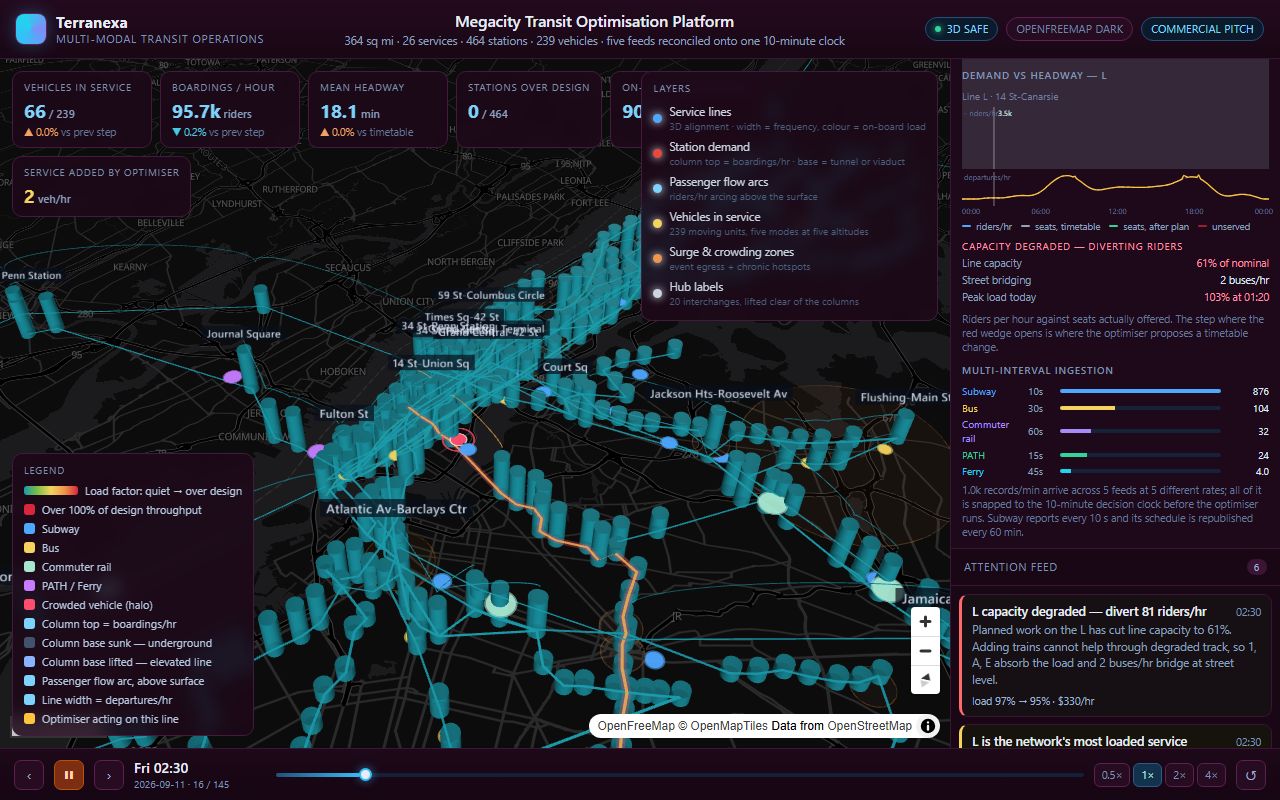
Megacity Transit Optimisation — the running interface
Transit Live
Multi-modal public transport

Megacity Transit Optimisation

Five separate transit feeds reconciled onto a single ten-minute decision clock, across 464 stations and 239 vehicles.

464 stations239 vehicles

Open the project
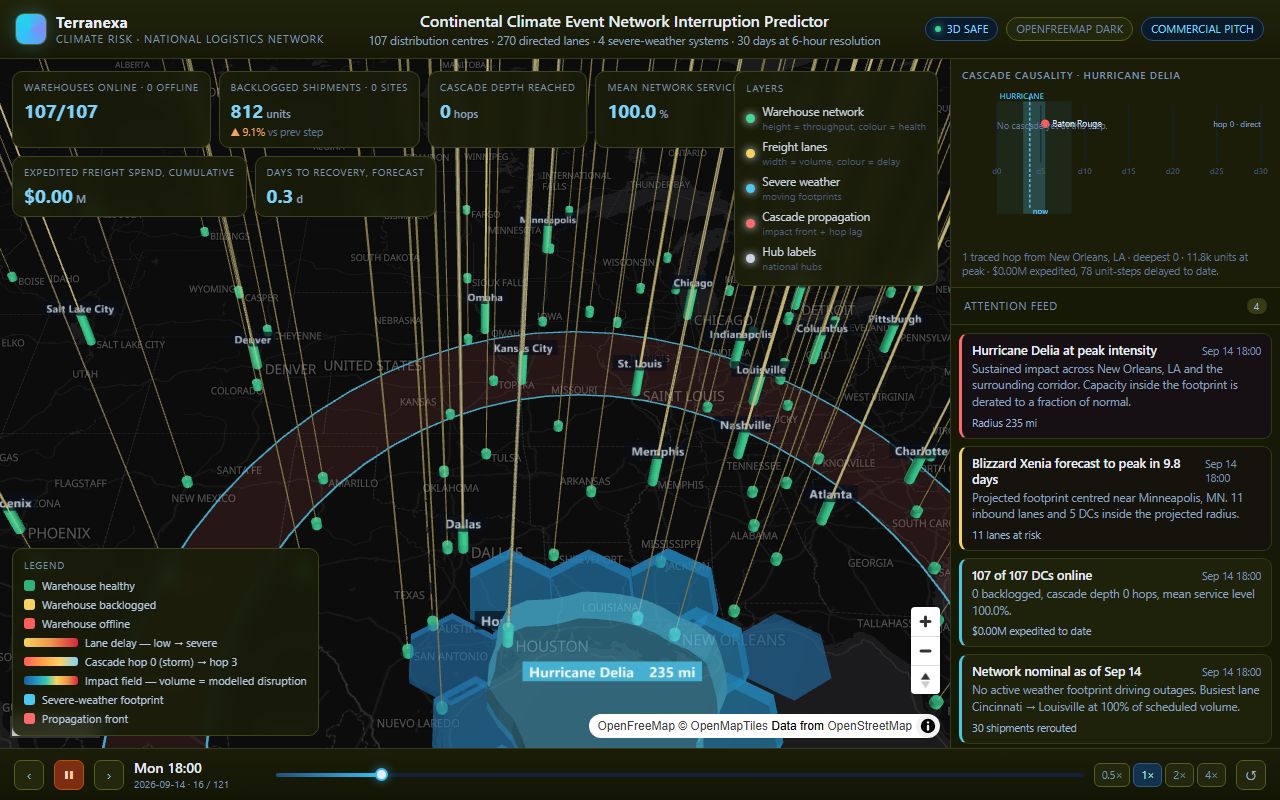
Climate Event Cascade Predictor — the running interface
Supply chain risk Live
Logistics network resilience

Climate Event Cascade Predictor

107 distribution centres and 270 transport lanes modelled against four severe weather systems — showing how a disruption at one site propagates through the network.

107 distribution centres270 lanes

Open the project
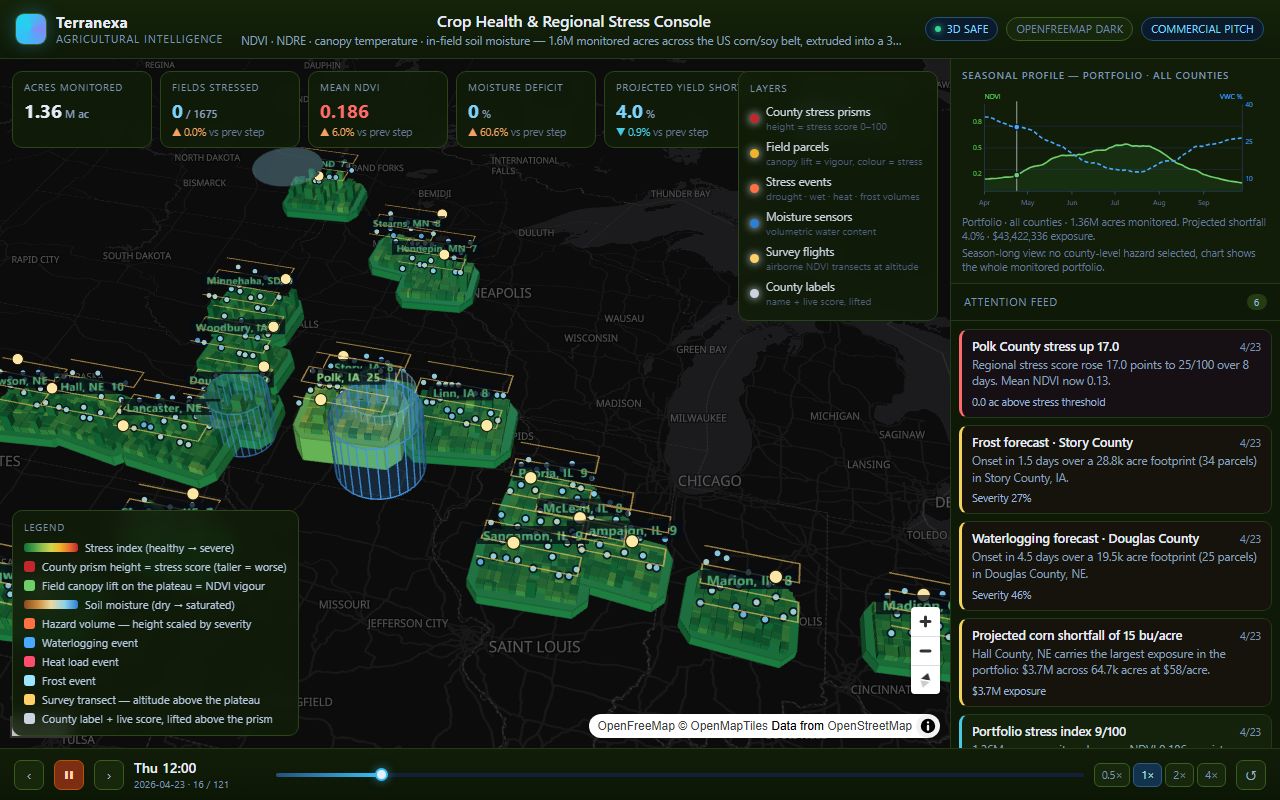
Crop Health & Regional Stress — the running interface
Agriculture Live
Agricultural intelligence

Crop Health & Regional Stress

1.6 million monitored acres across the US corn and soy belt, combining four satellite indices with in-field sensors into a 3D stress landscape.

1.6M acres320+ soil sensors

Open the project
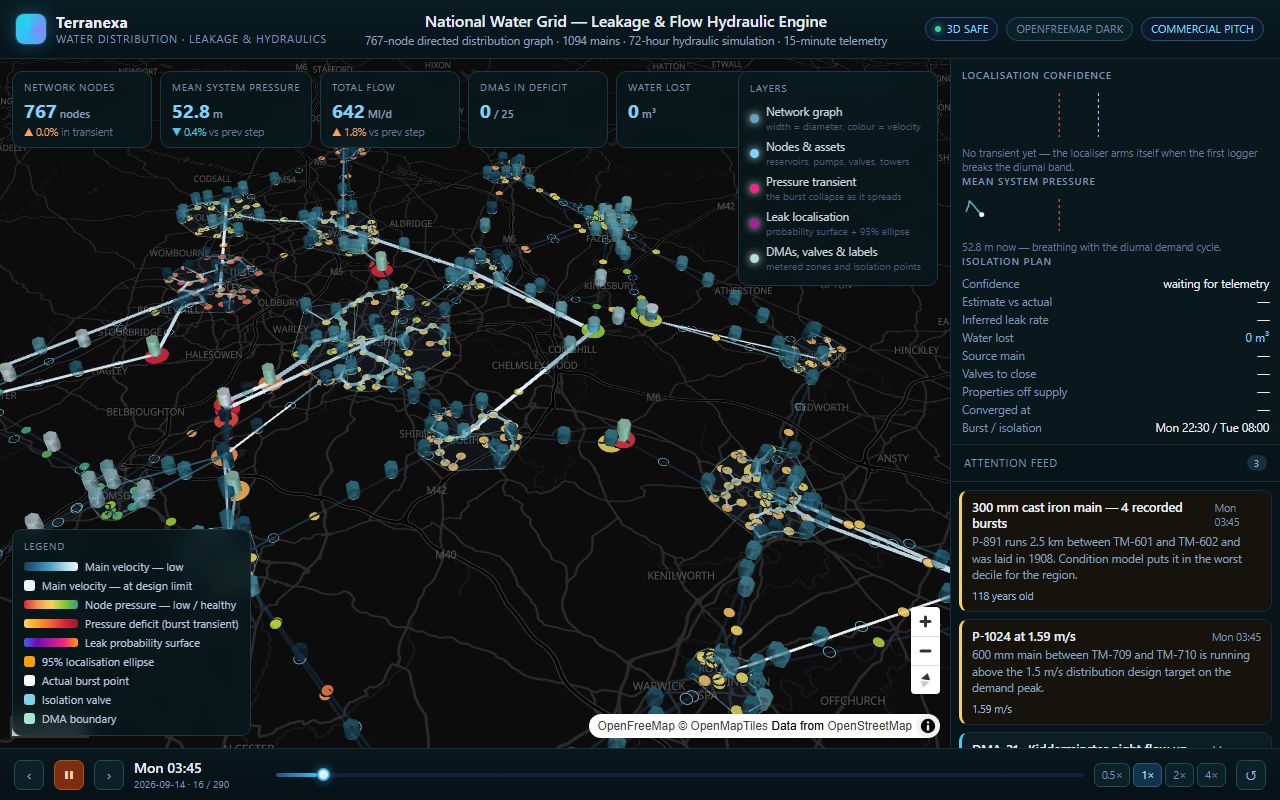
Water Grid Leakage & Hydraulics — the running interface
Water utilities Live
Water distribution

Water Grid Leakage & Hydraulics

A 767-node distribution network running a 72-hour hydraulic simulation, isolating where water is being lost and how flow redistributes downstream.

767 junctions1,094 mains

Open the project
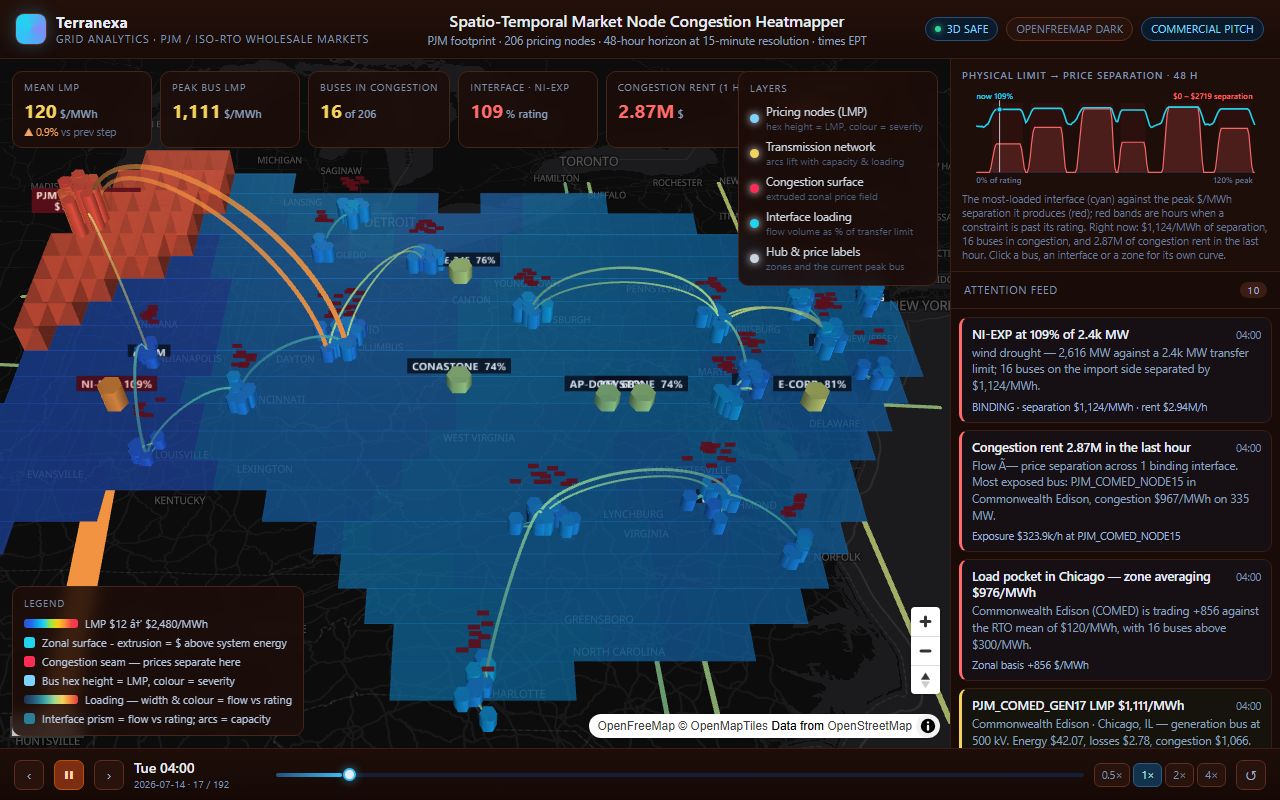
Market Node Congestion Heatmapper — the running interface
Energy markets Live
Wholesale power markets

Market Node Congestion Heatmapper

The PJM footprint across 206 pricing nodes and 48 hours — showing exactly where transmission congestion appears and what it costs.

206 pricing nodes48h horizon

Open the project
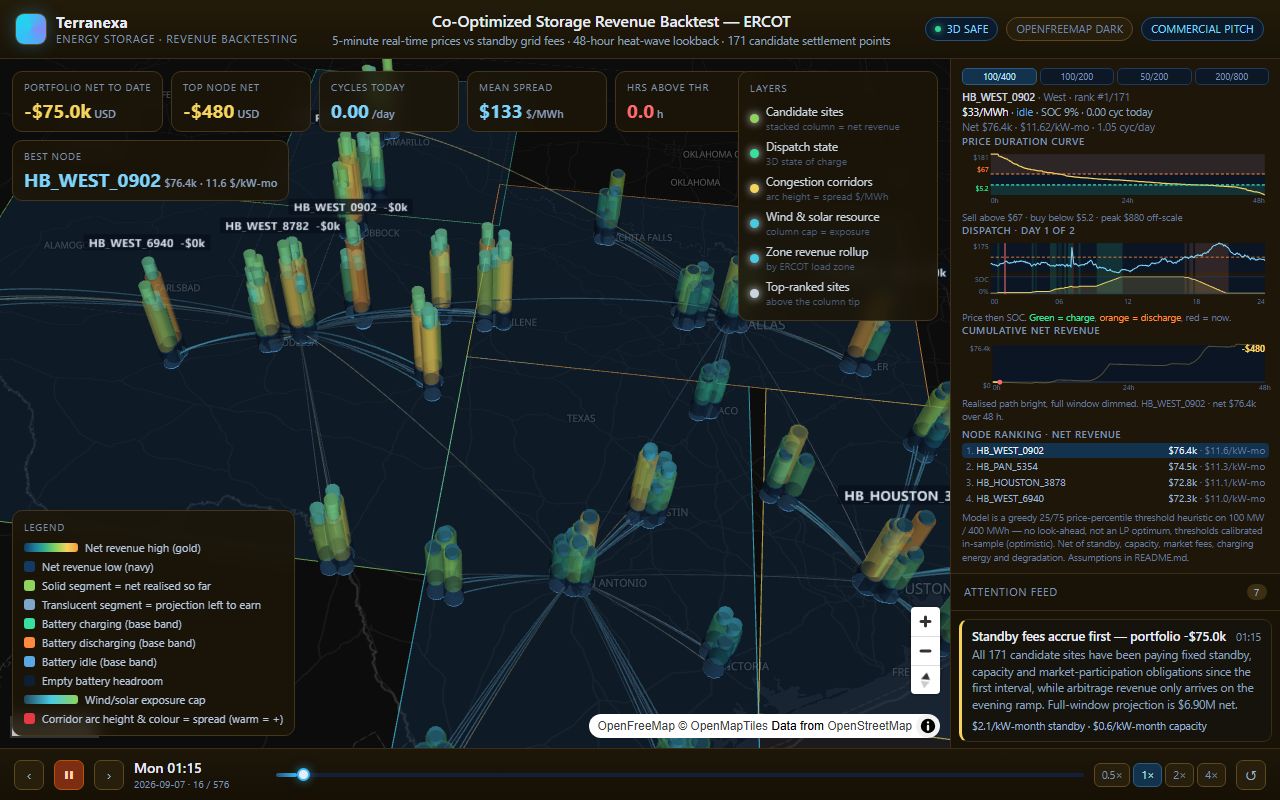
Storage Revenue Backtest — ERCOT — the running interface
Energy storage Live
Battery storage development

Storage Revenue Backtest — ERCOT

Backtests storage revenue across 171 settlement points against real five-minute prices and standby fees, over a 48-hour heat-wave window.

171 settlement points5min price resolution

Open the project
Elsewhere on this site

Buying through a tender, as a subcontractor or a joint venture?

If you are a prime bidder, consortium lead or contractor looking for a technical delivery partner rather than a system supplier, the commercial models, procurement answers and capability statement are on our partnerships page. Contracting entity, company number and registered office are on the company information page — THEAIPLUSPLUS LTD, company number 17397374, registered in England & Wales.

Start a conversation

Tell us what you need built

Send the problem, the constraints and the deadline. We will tell you honestly whether we are the right team, what we would need from you, and what a first deliverable would look like.

We reply to enterprise enquiries in under six hours. Prefer email? Write to hello@terranexamaps.com.