Continental Climate Event Network Interruption Predictor
Maps causality, not just geography: how a storm at one site degrades another.
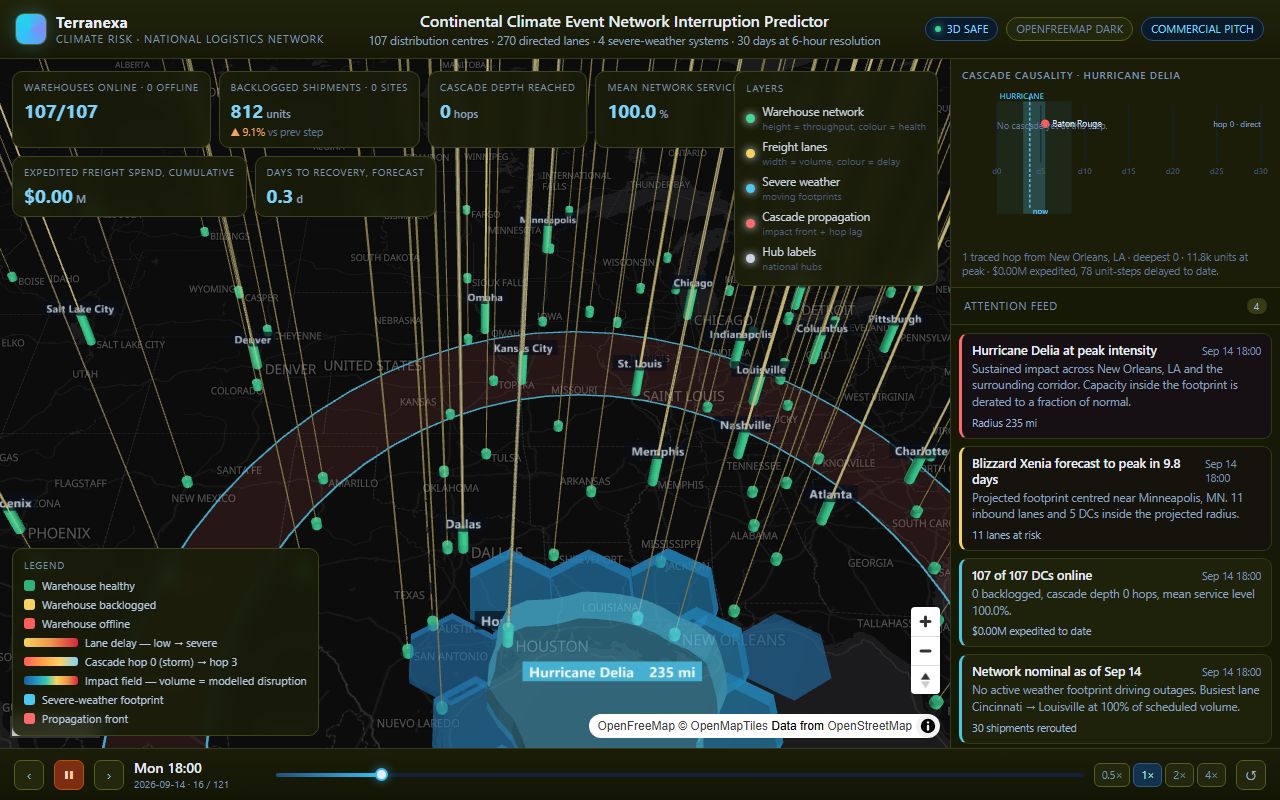
Captured from the running product. climatecausality.terranexamaps.com
Severe-weather feeds are fused with the physical freight network: 107 real US distribution centres and 270 directed lanes with real transit times. Every disruption is propagated through that graph rather than painted on a map.
A blizzard over Minneapolis reaches Omaha and Chicago two days later, and Kansas City’s service level falls after that. The cascade is quantified in the units operations actually manage — shipments backlogged, service level lost, expedited freight cost and days to recovery. Because the whole horizon is simulated up front, the wave is visible before it lands.
What is actually running
- Maps causality, not just geography — how an event at one site degrades operations at another.
- Disruptions propagate through the graph using real lane transit times, rather than appearing everywhere at once.
- Impact quantified in operational units: shipments backlogged, service level lost, expedited freight cost, days to recovery.
- The full 30-day horizon is simulated up front, so the forecast and the event are visible together.
Built with
Open the live product
This is the deployed application, not a recording. It opens in a new tab and runs in your browser.